In this category:
Overview

Accessed from the header menu

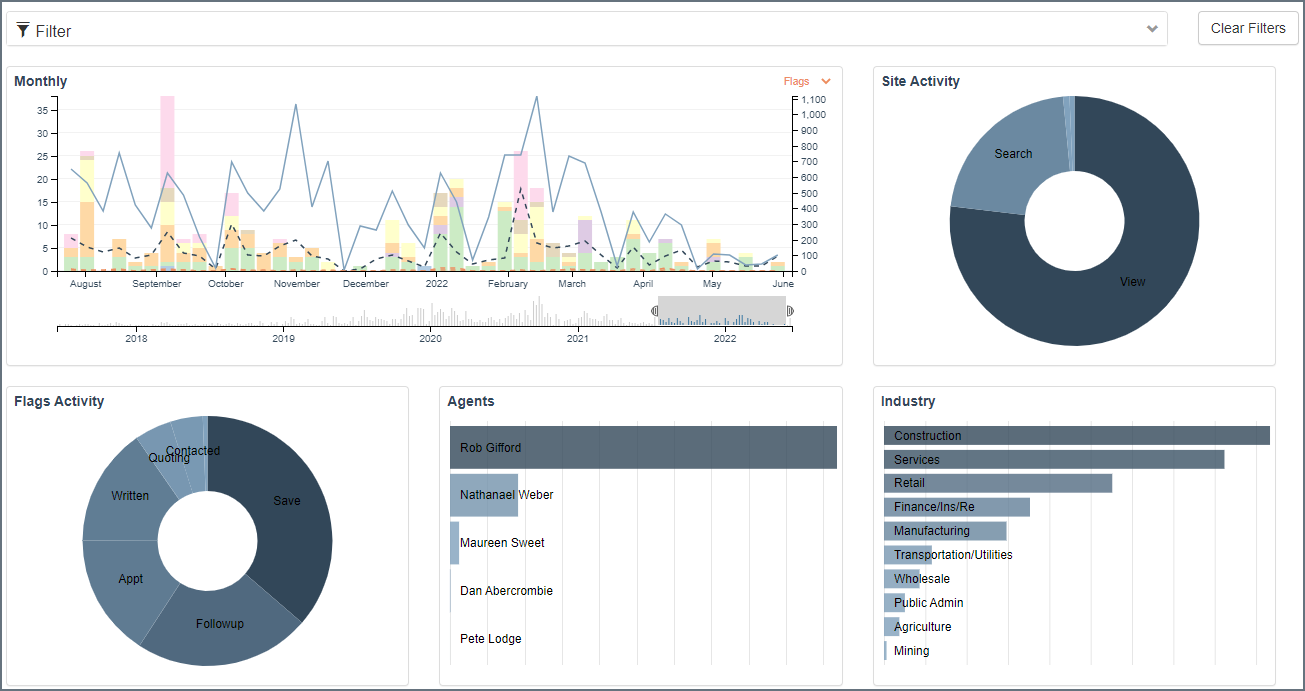
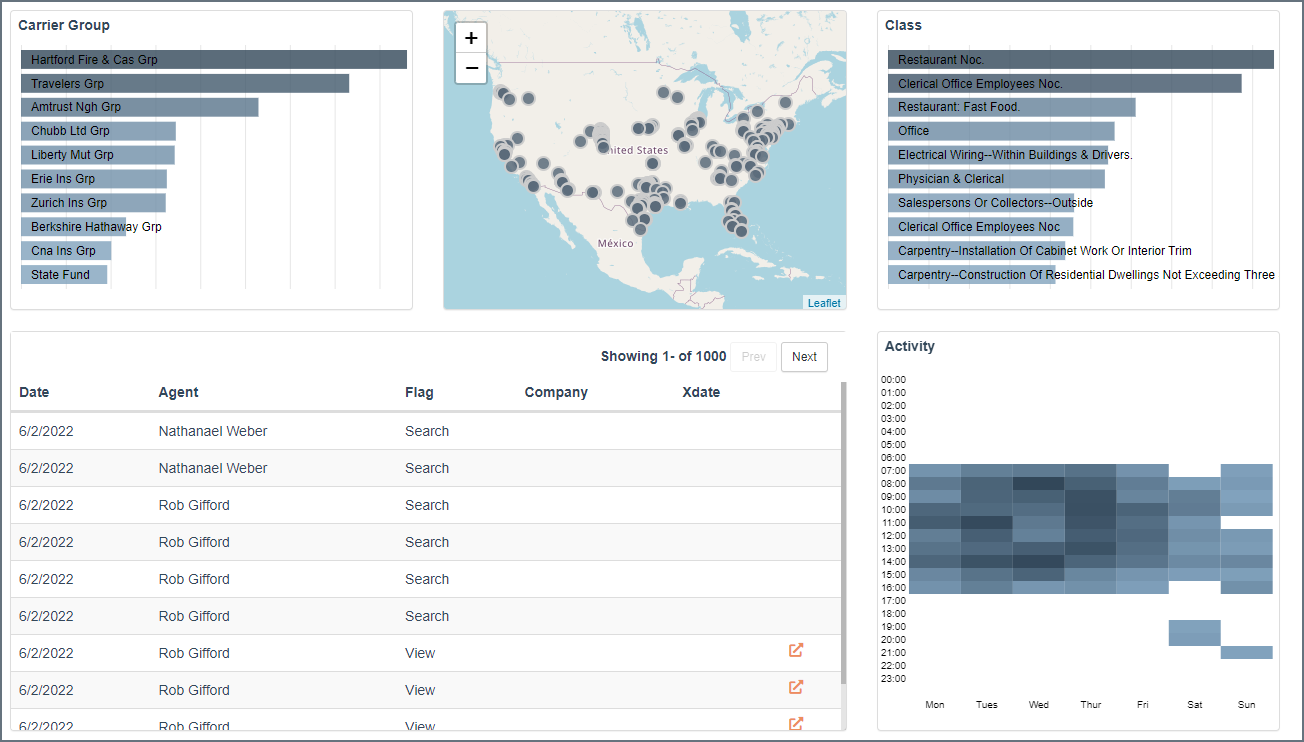
Totally overhauled in 2021 (and tweaked mid-2022), AgencyDash is a real-time report of activity. If you are a Master (main) account holder you have a birds eye view of your team's effort over time, aggregated with industry and class, incumbent carrier, location, and even the day of week/time of day.
It is fully interactive, so if you click on an agent it will filter everything else down to their activity. Or you could filter by stage, to see how many prospects are in the Quoting stage, for example. At the bottom is a list of accounts that represent the data powering the charts, your teams active accounts, which you can use to access details at the individual account level.
Time Filtering

- increase or decrease slider size, slide to view different time periods
Site Activity
- aggregates users' searches, views, notes and export actions.

If you are a single user or have an agent license on a Team account, you can view your personal activity here. Let's say you want to make sure you're spending your time wisely. Filter by Written account, check the class and industry charts. Then clear the filter and see what you're quoting and who you're tracking down with follow ups to see if your current activity is aligned with your recent success.
Or let's say you want to know if there is a particular day or time you have the most success scheduling an appointment. Filter to show only appointments by clicking on the appropriate slice in the pie chart and check out the activity heat map (hover over the block to view hard number).
You can also view the most recent 1,000 records you or your team have flagged as well as their site activity.