OSHA Data

Written by rob g
Updated at February 27th, 2025
In this category:
Table of Contents
Inspection Info

At the top is the inspection date on the left, and to the right are the number of violations, number of Employees recorded, private/public establishment, union or non-union and type of inspection.
Inspections are typically planned, but will also include referral, employee complaint, reported incident, etc.
Planned inspections (also known as programmed inspections) are usually comprehensive whereas unprogrammed (coming from a referral or complaint) are partial and focus on the specific work area, operation, machine, etc that was reported in the complaint.
Violation Data
Standard number violated and general text description
Type
Violation type factors into the penalty charged. Violations can be Serious, Other (other than serious), Repeated (meaning this isn't the first time they've been told to fix a problem), Posting Requirements or Failure to Abate. Below is a table indicating min and max amounts -
| Type of Violation | Penalty Minimum | Penalty Maximum |
|---|---|---|
| Serious | [$975] per violation | $13,653 per violation |
| Other-Than-Serious | $0 per violation | $13,653 per violation |
| Willful or Repeated | [$9,753*] per violation | $136,532 per violation |
| Posting Requirements | $0 per violation | $13,653 per violation |
| Failure to Abate | N/A | $13,653 per day unabated beyond the abatement date [generally limited to 30 days maximum] |
Gravity
Gravity is a factor in Serious violations - 10 is high, 5 is moderate and 1 is low. Below table indicates gravity based penalty amounts -
| Severity | Probability | GBP | Gravity | OIS Code |
|---|---|---|---|---|
| High | Greater | $13,653 | High | 10 |
| Medium | Greater | $11,703 | Moderate | 5 |
| Low | Greater | $9,753 | Moderate | 5 |
| High | Lesser | $9,753 | Moderate | 5 |
| Medium | Lesser | $7,802 | Moderate | 5 |
| Low | Lesser | $5,851 | Low | 1 |
Penalty
These are the fines charged for the violation. Penalties can be adjusted (reduced) with a favorable history (up to 10%), up to 25% for 'good faith efforts' and up to a 70% reduction for size (number of employees). Below table indicates the percent reduction based on size -
| Employees | Percent Reduction |
|---|---|
| 1-10 | 70 |
| 11-25 | 60 |
| 26-100 | 30 |
| 101-250 | 10 |
| 251 or more | None |
This table is used for Serious Willful Penalties and helps minimize the impact of large penalties for small employers w/ 50 or fewer employees -
| Employees | Percent reduction |
|---|---|
| 10 or fewer | 80 |
| 11-20 | 60 |
| 21-30 | 50 |
| 31-40 | 40 |
| 41-50 | 30 |
| 51-100 | 20 |
| 101-250 | 10 |
| 251 or more | 0 |
Display Areas
OSHA summary data is displayed in the Policy modal

Look for this icon in List View:

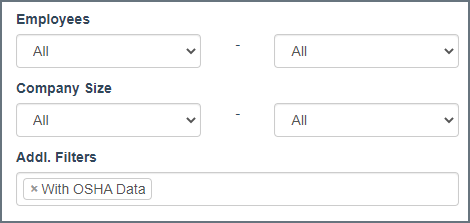
Search by OSHA data (requires Enhanced Search add-on)
Available in the 'Addl. Options' -